
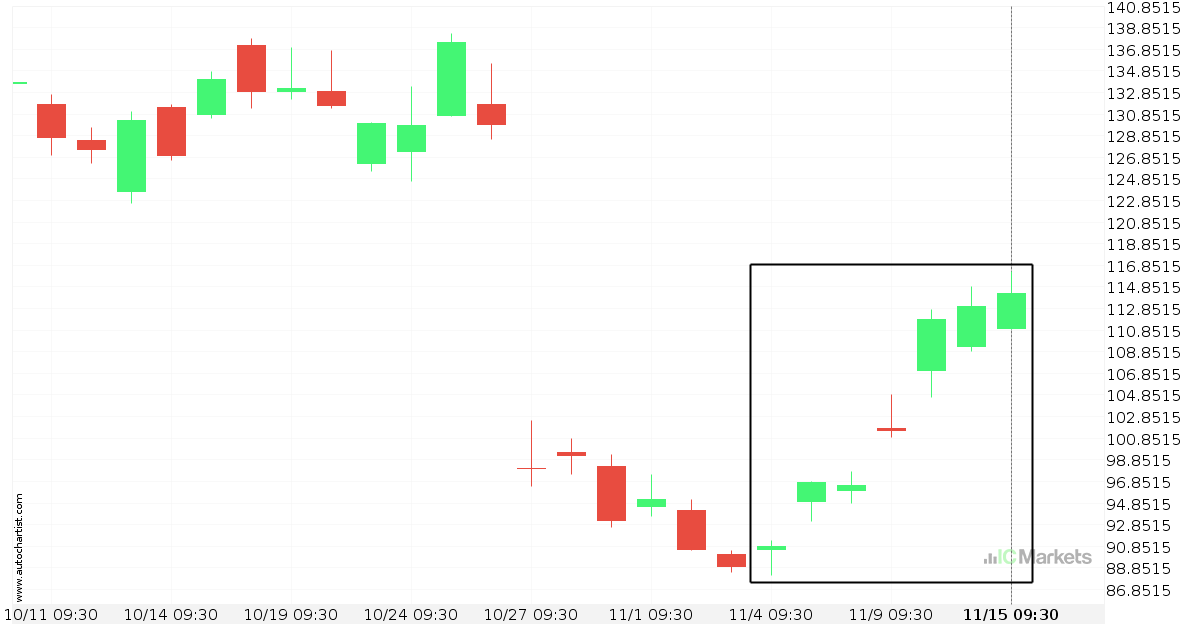
What’s going on with Meta Platforms, Inc. – Class A Common Stock?
Those of you that are trend followers are probably eagerly watching Meta Platforms, Inc. – Class A Common Stock to see if its latest 25.79% move continues. If not, the mean-reversion people out there will be delighted with this exceptionally large 12 days move.

Either a rebound or a breakout imminent on Tesla Inc.
Tesla Inc. is heading towards a line of 186.7600. If this movement continues, the price of Tesla Inc. could test 186.7600 within the next 7 hours. But don’t be so quick to trade, it has tested this line numerous times in the past, so this movement could be short-lived and end up rebounding.
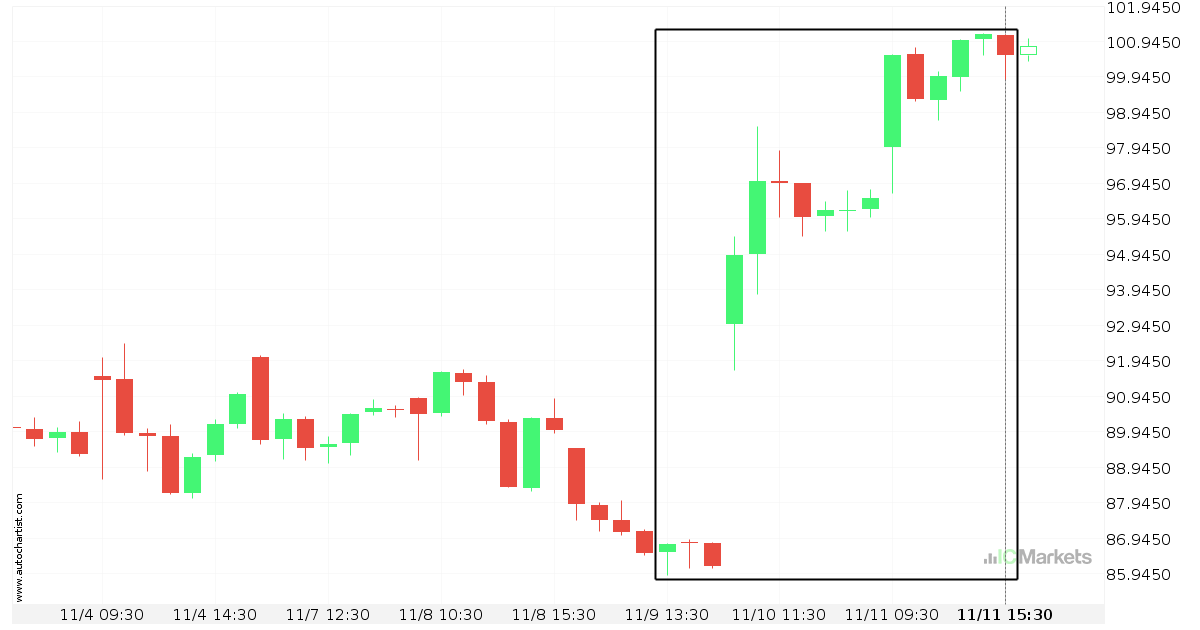
Huge bullish move on Amazon.Com Inc.
Amazon.Com Inc. has moved higher by 15.89% from 86.77 to 100.56 in the last 3 days.
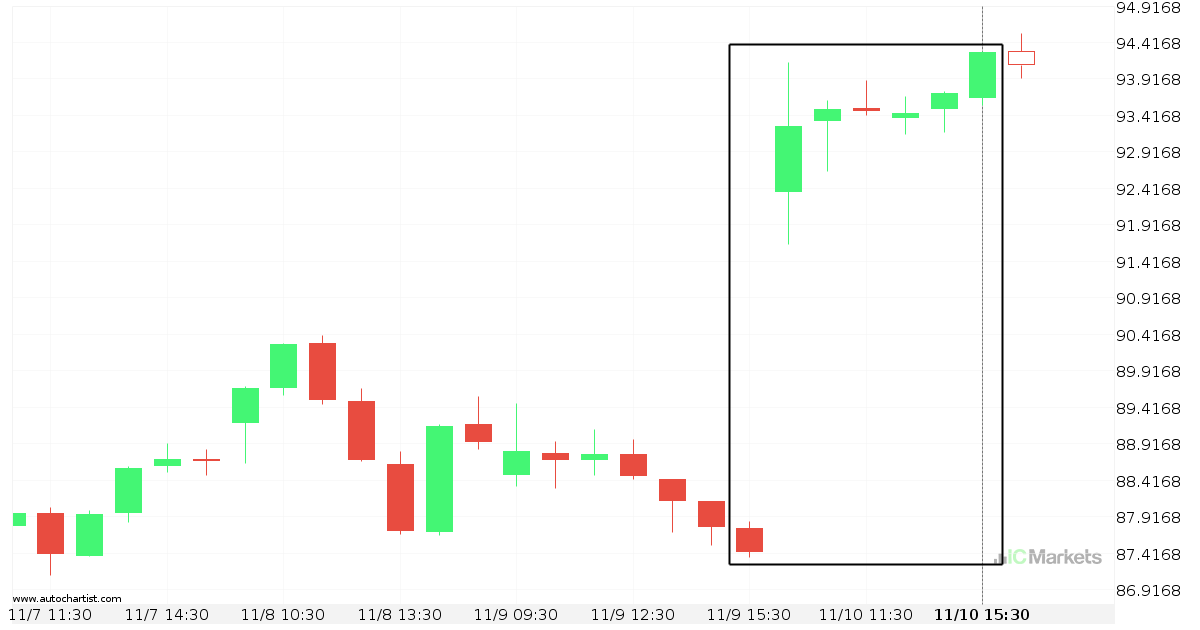
Huge bullish move on ALPHABET INC CLASS C
ALPHABET INC CLASS C has moved higher by 7.83% from 87.43 to 94.275 in the last 2 days.
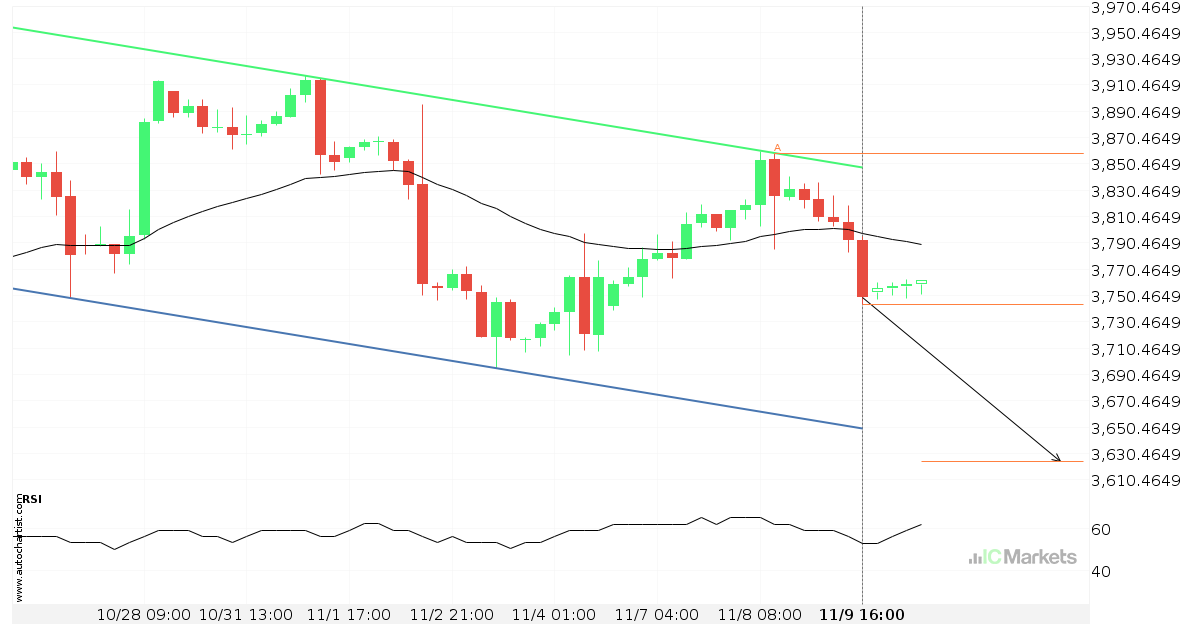
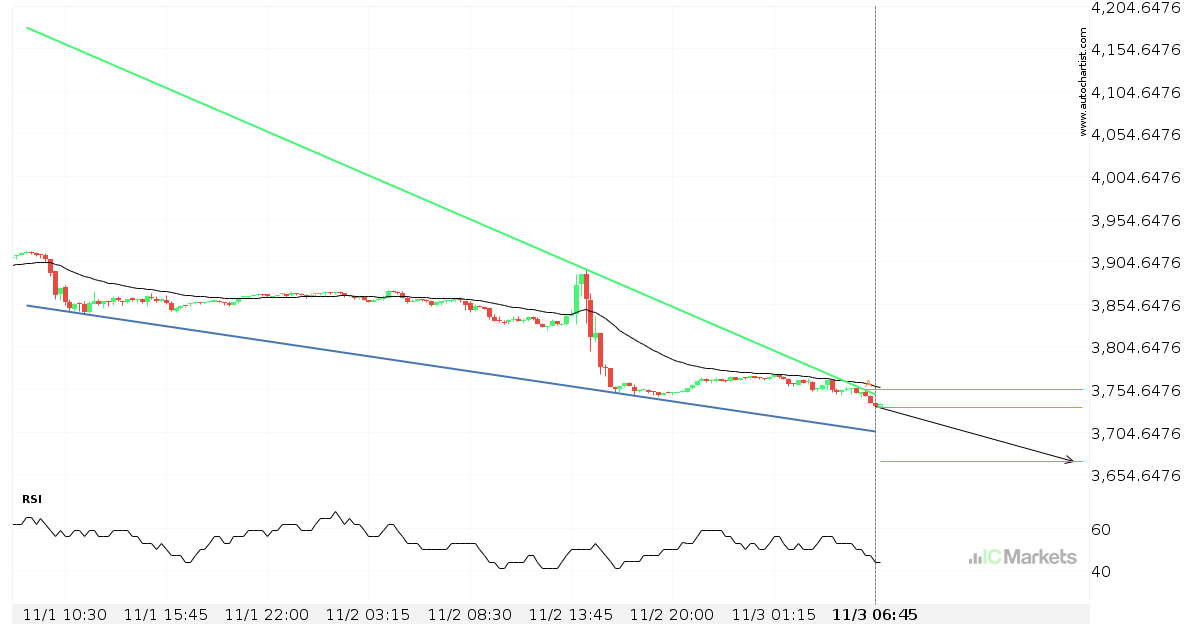
US SPX 500 Index approaching support of a Channel Down
US SPX 500 Index is approaching the support line of a Channel Down. It has touched this line numerous times in the last 15 days. If it tests this line again, it should do so in the next 3 days.
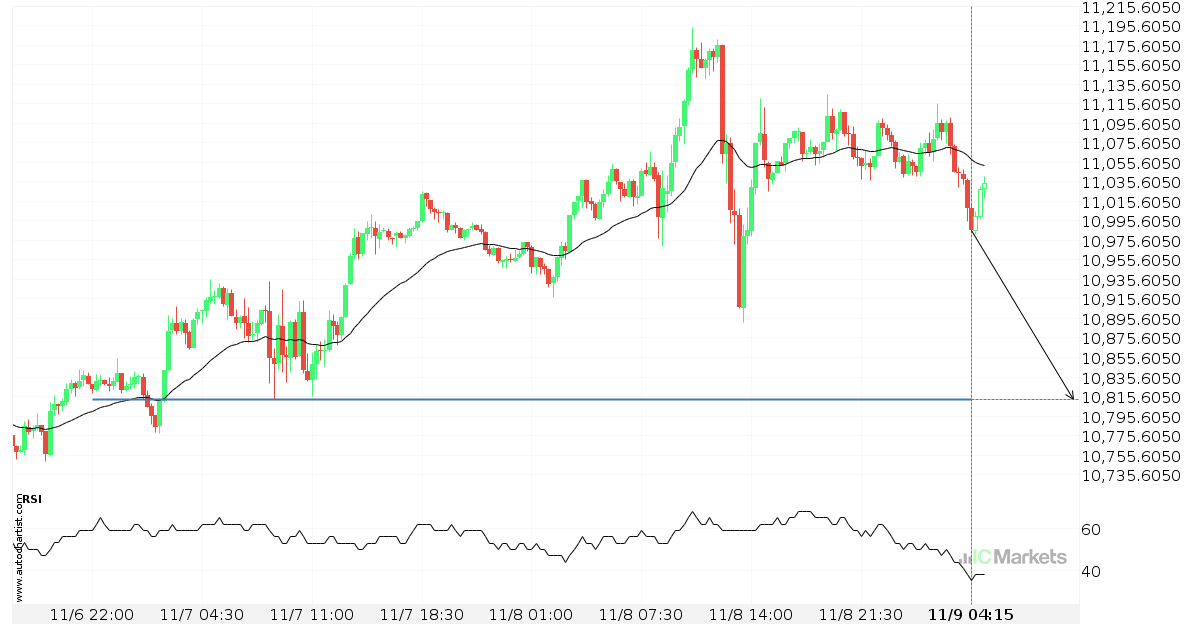
US Tech 100 Index – getting close to psychological price line
US Tech 100 Index is moving towards a support line. Because we have seen it retrace from this level in the past, we could see either a break through this line, or a rebound back to current levels. It has touched this line numerous times in the last 3 days and may test it again […]
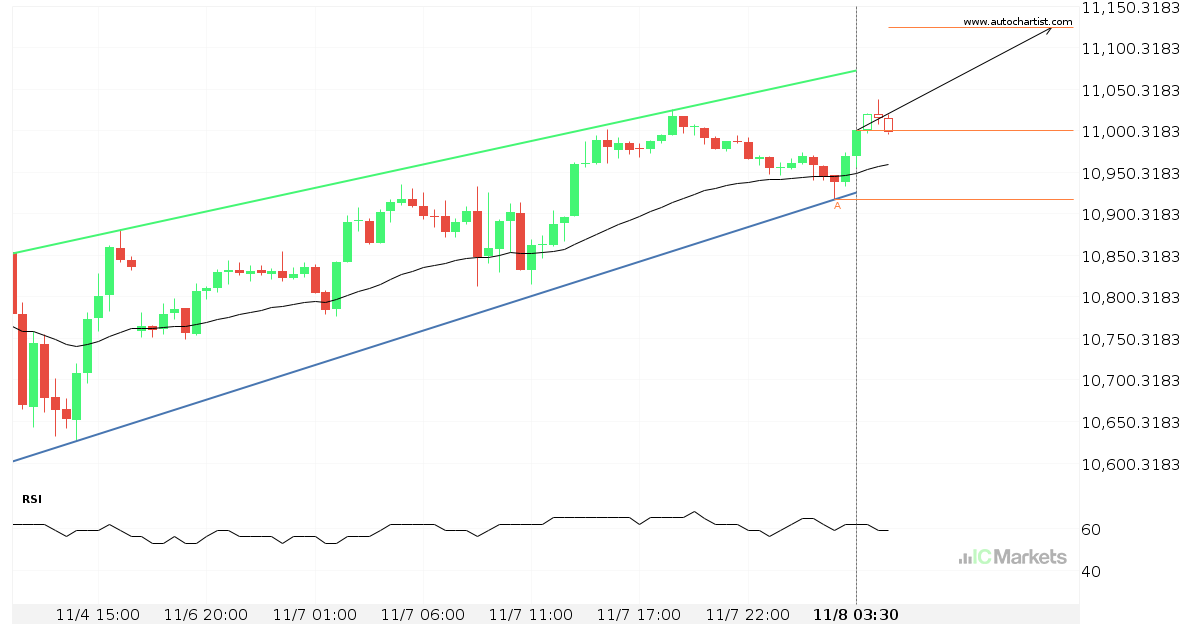
US Tech 100 Index approaching resistance of a Channel Up
US Tech 100 Index is approaching the resistance line of a Channel Up. It has touched this line numerous times in the last 4 days. If it tests this line again, it should do so in the next 10 hours.
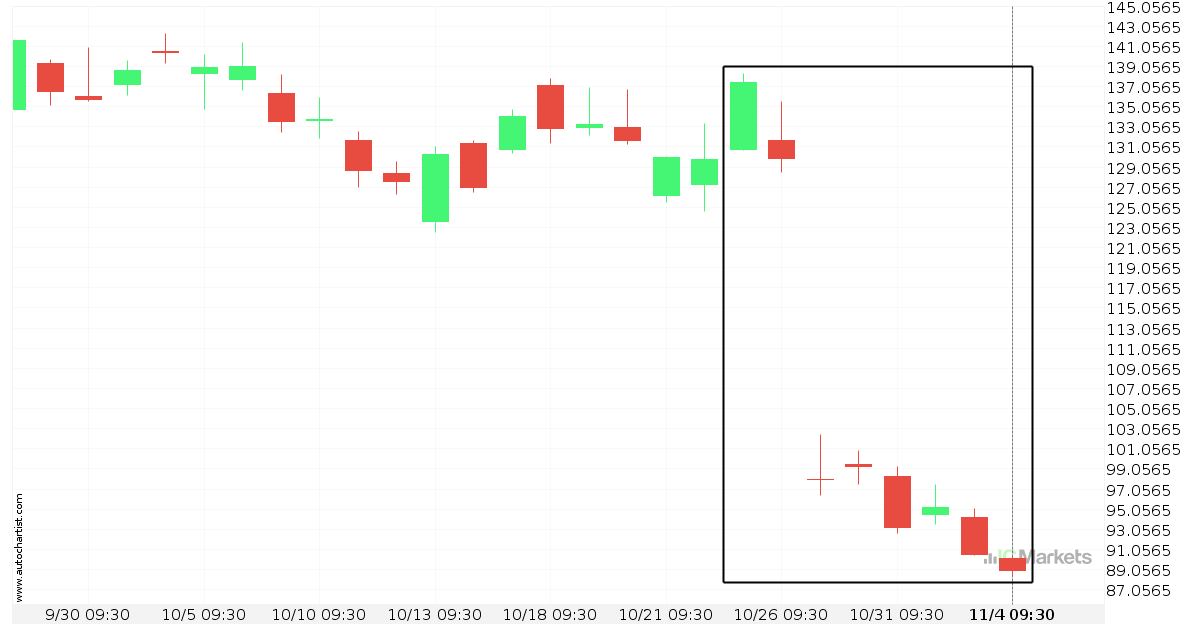
Huge bearish move on Meta Platforms, Inc. – Class A Common Stock
Meta Platforms, Inc. – Class A Common Stock has moved lower by 35.33% from 137.46 to 88.9 in the last 11 days.

Huge bearish move on Meta Platforms, Inc. – Class A Common Stock
Meta Platforms, Inc. – Class A Common Stock has moved lower by 30.74% from 137.46 to 95.2 in the last 9 days.
US SPX 500 Index approaching support of a Falling Wedge
US SPX 500 Index is approaching the support line of a Falling Wedge. It has touched this line numerous times in the last 2 days. If it tests this line again, it should do so in the next 13 hours.